
Mutual Funds vs Fixed Deposits: 25-Year Return Comparison (Real Data)
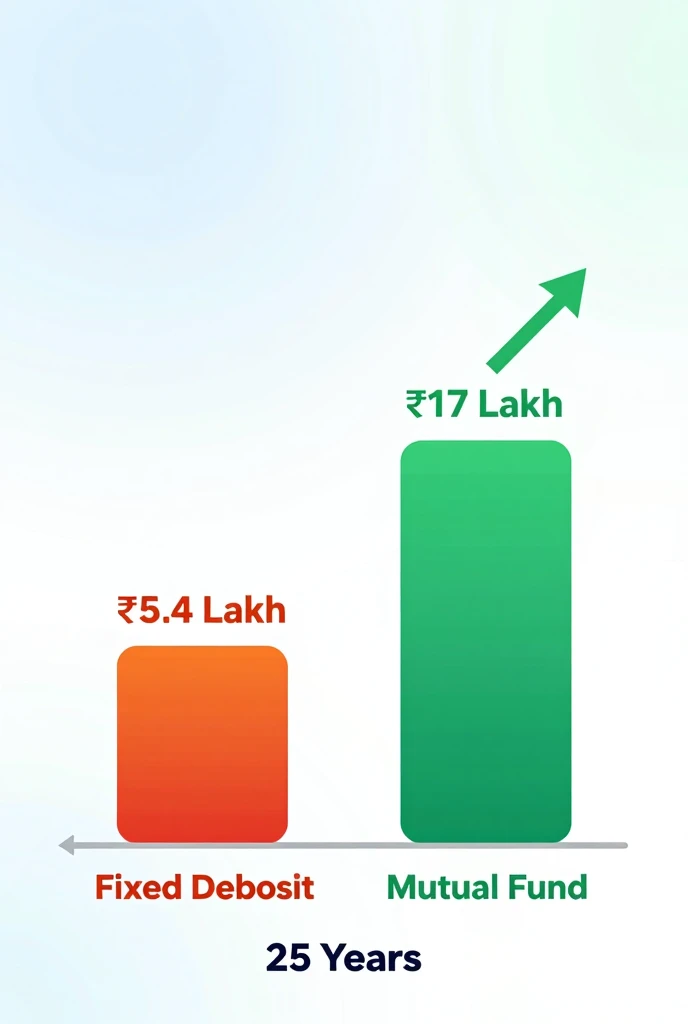
Your ₹1 lakh invested today could grow to ₹5.4 lakh in an FD — or ₹17 lakh in a mutual fund. The difference is not luck. It’s compounding, returns, and time. Here’s the complete truth.
Introduction: The ₹1 Crore Question Most Indians Get Wrong
Every year, millions of Indian families park their hard-earned savings in Fixed Deposits. It feels safe. It feels certain. And for decades, it was the only “respectable” option. But here is the uncomfortable truth that most bank managers will never tell you: FD returns have consistently failed to beat inflation over the long run.
Meanwhile, equity mutual funds — once considered exotic and risky — have compounded investor wealth at 10–14% CAGR for decades. The 25-year gap between these two instruments is not just significant; it’s life-changing.
This article delivers a rigorous, data-backed comparison of Mutual Funds vs Fixed Deposits across 25 years — covering returns, taxation, inflation, liquidity, risk, and real-life scenarios — so you can make the most informed investment decision of your life.
What Is a Fixed Deposit (FD)?
A Fixed Deposit (FD) is a financial instrument offered by banks and NBFCs where you deposit a lump sum for a fixed tenure at a predetermined interest rate. Governed by the Reserve Bank of India (RBI), FDs are one of India’s most trusted savings tools.
- Interest rates: Currently 6.5%–7.5% for general public; up to 8% for senior citizens
- Tenure: 7 days to 10 years
- Capital protection: Deposits up to ₹5 lakh insured by DICGC
- Payout options: Monthly, quarterly, annually, or on maturity
- Tax: Interest fully taxable as per income tax slab
Most investors ignore the post-tax, post-inflation FD return. If your FD earns 7% and you’re in the 30% tax bracket, your effective return is ~4.9%. With India’s average CPI inflation at 5–6%, your real return on FD is often near zero — or even negative.
What Are Mutual Funds?
A mutual fund pools money from thousands of investors and invests it in equities, bonds, gold, or a mix — managed by a professional fund manager. Regulated by SEBI (Securities and Exchange Board of India), mutual funds offer market-linked returns without requiring direct stock-picking expertise.
- Types: Equity, Debt, Hybrid, Index, ELSS, International
- Historical returns (equity): 10–14% CAGR over 15–25 year periods
- Minimum investment: ₹500/month via SIP
- Regulation: SEBI-registered AMCs; AMFI India tracks all mutual fund data
- Tax: LTCG tax of 10% on equity gains above ₹1 lakh (post 1 year)
The Nifty 50 Total Return Index has delivered approximately 13.2% CAGR over the last 25 years (2000–2025) despite multiple market crashes including the 2008 Global Financial Crisis, 2020 COVID crash, and 2022 rate hike correction. Time in the market beats timing the market.
25-Year Return Comparison: ₹1 Lakh Invested (Lump Sum)
Let’s run the actual numbers. Assume a one-time lump sum investment of ₹1,00,000 on 1st April 2000, held until April 2025 (25 years). We compare three FD scenarios and three mutual fund scenarios.
Formula used: Future Value = P × (1 + r)ⁿ
| Investment Option | Annual Return (CAGR) | Maturity Value | Wealth Gained |
|---|---|---|---|
| Fixed Deposit (Conservative) | 6.0% | ₹4,29,187 | ₹3,29,187 |
| Fixed Deposit (Typical) | 7.0% | ₹5,42,743 | ₹4,42,743 |
| Fixed Deposit (Senior Citizen) | 7.5% | ₹6,09,845 | ₹5,09,845 |
| Debt Mutual Fund | 8.5% | ₹7,21,069 | ₹6,21,069 |
| Balanced / Hybrid Fund | 10.5% | ₹11,26,835 | ₹10,26,835 |
| Equity Mutual Fund (Typical) | 12.0% | ₹17,00,006 | ₹16,00,006 |
| Large-Cap Index Fund (Nifty 50) | 13.0% | ₹21,23,080 | ₹20,23,080 |
A ₹1 lakh FD at 7% returns ₹5.43 lakh after 25 years. The same amount in a diversified equity mutual fund at 12% CAGR returns ₹17 lakh. That’s ₹11.57 lakh extra wealth from the same ₹1 lakh. This is the compounding gap — and it widens every year you wait.
SIP vs FD: 25-Year Monthly Investment Comparison
Now let’s compare the more realistic scenario: monthly investments. A Systematic Investment Plan (SIP) is how most investors access mutual funds — investing ₹5,000 per month steadily. How does this compare to depositing ₹5,000/month in an RD (Recurring Deposit — the FD equivalent)?
Total invested over 25 years: ₹5,000 × 300 months = ₹15,00,000
| Instrument | Monthly Invest | Expected CAGR | Total Invested | Maturity Value | Wealth Created |
|---|---|---|---|---|---|
| Recurring Deposit | ₹5,000 | 6.5% | ₹15,00,000 | ₹28,57,000 | ₹13,57,000 |
| Recurring Deposit (Senior) | ₹5,000 | 7.5% | ₹15,00,000 | ₹33,97,000 | ₹18,97,000 |
| SIP — Debt Fund | ₹5,000 | 8.5% | ₹15,00,000 | ₹40,59,000 | ₹25,59,000 |
| SIP — Hybrid Fund | ₹5,000 | 11.0% | ₹15,00,000 | ₹68,73,000 | ₹53,73,000 |
| SIP — Equity Fund (12%) | ₹5,000 | 12.0% | ₹15,00,000 | ₹83,12,000 | ₹68,12,000 |
| SIP — Index Fund (13%) | ₹5,000 | 13.0% | ₹15,00,000 | ₹1,01,29,000 | ₹86,29,000 |
The math is staggering: a ₹5,000/month SIP in an equity fund at 12% CAGR grows to ₹83.12 lakh in 25 years. The same investment in an RD at 6.5% yields only ₹28.57 lakh. That’s a difference of over ₹54 lakh — from the same ₹5,000/month habit.
Want to learn more about building a structured investment plan? Read our guide on SIP investment strategy for step-by-step insights.
Taxation: The Hidden Return Killer
Returns on paper mean little if taxation eats them up. This is one of the most underappreciated dimensions of the FD vs mutual fund debate — and it heavily favours mutual funds for most investors.
| Parameter | Fixed Deposit | Equity Mutual Fund | Debt Mutual Fund |
|---|---|---|---|
| Tax on returns | As per income slab (up to 30%) | 10% LTCG (after ₹1L exempt) | As per income slab |
| TDS applicability | Yes — 10% TDS if interest > ₹40,000/yr | No TDS on equity MF gains | No TDS for resident individuals |
| Short-term tax (under 1 yr / 3 yrs) | Slab rate | 15% STCG | Slab rate |
| Long-term holding period | N/A | > 1 year | > 3 years (indexation benefit removed) |
| Indexation benefit | Not applicable | Not applicable | Removed from FY2023 |
| Effective post-tax return (30% bracket) | ~4.9% (on 7% FD) | ~10.8% (on 12% CAGR) | ~5.95% (on 8.5% CAGR) |
If you’re in the 30% income tax slab, every ₹100 of FD interest leaves you with just ₹70 after tax. In contrast, equity mutual fund gains above ₹1 lakh are taxed at only 10%, meaning you retain ₹90 for every ₹100 of gain. Over 25 years, this tax efficiency alone adds lakhs of rupees to your final corpus.
For tax-saving investments that combine ELSS mutual funds with Section 80C benefits, explore our guide on tax saving investments.
Source: Income Tax India (incometaxindia.gov.in)
Inflation Impact: The Silent Wealth Destroyer
India’s average Consumer Price Inflation (CPI) over the last 25 years has hovered between 5–6% per annum. This completely changes the FD vs mutual fund narrative. Let’s calculate real returns (returns after adjusting for inflation).
| Instrument | Nominal Return | Post-Tax Return (30% slab) | Real Return (After 5.5% Inflation) |
|---|---|---|---|
| FD (7%) | 7.0% | 4.9% | –0.57% (Negative) |
| FD — Senior Citizen (7.5%) | 7.5% | 5.25% | –0.24% (Near Zero) |
| Debt Mutual Fund (8.5%) | 8.5% | 5.95% | +0.43% |
| Equity Mutual Fund (12%) | 12.0% | 10.8% | +5.3% (Real Wealth Creation) |
| Index Fund / Nifty 50 (13%) | 13.0% | 11.7% | +6.2% (Highest Real Return) |
The verdict on inflation: FDs, after tax and inflation, generate near-zero or negative real returns for individuals in higher tax brackets. Equity mutual funds, despite their volatility, are the only mainstream investment category that has consistently generated meaningful real wealth over long periods.
Risk vs Return: Understanding What You’re Actually Buying
Risk is not the enemy of investment — ignorance of risk is. Here’s an honest breakdown of the risk profile of both instruments:
| Risk Parameter | Fixed Deposit | Equity Mutual Fund |
|---|---|---|
| Capital Protection | Yes (up to ₹5L via DICGC) | No guaranteed protection |
| Return Predictability | Fixed and known upfront | Market-linked, variable |
| Short-term Volatility | Zero | High (can be –30% to –50%) |
| Long-term Wealth Risk (inflation) | High (real value erosion) | Low (historically beats inflation) |
| Worst 1-year return (historical) | Never negative | –52% (Nifty in 2008–09) |
| Best 1-year return (historical) | ~9% (2010 era) | +74% (Nifty in 2009–10) |
| Probability of loss over 10+ years | Zero (nominal) | <5% historically for diversified equity |
Investors confuse short-term volatility with long-term risk. FDs have zero short-term volatility but carry significant long-term purchasing power risk. Equity mutual funds appear risky in the short run but are historically the most reliable long-term wealth builders. Time horizon is everything.
Liquidity Comparison
Liquidity — how quickly and cheaply you can access your money — is a critical but often overlooked factor in the mutual fund vs FD debate.
| Parameter | Fixed Deposit | Equity Mutual Fund |
|---|---|---|
| Premature withdrawal | Allowed with 0.5–1% penalty | Redeemable anytime (exit load up to 1% within 1 yr) |
| Settlement time | Same or next working day | T+2 for equity funds |
| Partial withdrawal | Usually requires full break | Partial redemption easily possible |
| Loan against investment | Available (up to 90% of FD value) | Available at some AMCs |
| Tax-saver (5-yr) FD liquidity | Locked for 5 years | ELSS locked for 3 years only |
For most investors, mutual funds offer comparable or superior liquidity to FDs, especially for amounts above ₹5 lakh where the DICGC insurance cap becomes irrelevant for FDs anyway.
Real-Life Scenario Examples
📍 Scenario 1: Raj, 30-year-old IT professional, ₹10,000/month to invest
- FD route (7%): After 25 years → ~₹57.26 lakh (taxed at 30% slab throughout)
- SIP route (12% equity fund): After 25 years → ~₹1.66 crore (10% LTCG on gains above ₹1L/year)
- Raj’s extra wealth from SIP: Over ₹1 crore more from the same ₹10,000/month
📍 Scenario 2: Sunita, 55-year-old retiree, ₹20 lakh lump sum
- FD (7.5% senior citizen rate): Generates ~₹12,500/month interest income — predictable, safe
- Hybrid Mutual Fund (10.5% SWP): Generates ~₹17,500/month via Systematic Withdrawal Plan with growing corpus
- Verdict for Sunita: FD is acceptable, but a debt-heavy hybrid fund with SWP could deliver 30–40% more monthly income with manageable risk
📍 Scenario 3: Priya, 25-year-old, first-time investor, ₹3,000/month
- Started SIP in a Nifty 50 index fund in 2000 at ₹3,000/month
- In 2025, her corpus stands at approximately ₹65–70 lakh
- The same ₹3,000/month in an RD would have yielded roughly ₹18–19 lakh
Starting early is the single most powerful variable. ₹3,000/month invested for 30 years at 12% = ₹1.05 crore. The same ₹3,000/month invested for 20 years at 12% = ₹29.96 lakh. Ten extra years of compounding nearly triples the final corpus. Don’t wait. Learn how to start investing today.
Pros and Cons: FD vs Mutual Funds
Fixed Deposit
- Guaranteed returns — no market risk
- Capital protected (DICGC up to ₹5L)
- Easy to understand and open
- Loan facility against FD
- Ideal for short-term goals (1–3 years)
- Senior citizens get extra 0.25–0.50% rate
- Returns don’t beat inflation post-tax for high earners
- Interest fully taxable at slab rate
- Premature withdrawal penalty
- No upside in good economic conditions
- 5-year tax-saver FD has lock-in with no liquidity
- Returns fall during rate-cut cycles
Mutual Funds
- Historically superior long-term returns (10–14%)
- Tax-efficient (10% LTCG vs 30% slab for FD)
- SIP allows disciplined wealth creation from ₹500
- Highly liquid — redeem any time
- ELSS saves tax under Section 80C with only 3-yr lock-in
- Diversification across sectors/geographies
- No capital guarantee — market risk exists
- Requires patience and long-term discipline
- Short-term returns can be volatile and negative
- Expense ratio reduces returns slightly
- Not ideal for very short-term needs (<1 year)
- Requires basic financial literacy
Which Is Better — And For Whom?
| Investor Profile | Recommended Option | Why |
|---|---|---|
| Retired, needs monthly income | FD + Debt Fund combo | Capital safety + reliable income |
| 25–40 years, long-term wealth creation | Equity Mutual Fund (SIP) | High compounding potential over time |
| Emergency fund (6 months’ expenses) | FD or Liquid Mutual Fund | Safety + liquidity paramount |
| Tax saving (Section 80C) | ELSS Mutual Fund | Best returns + shortest 3-yr lock-in |
| Goal in 1–3 years (house, car) | FD or Short Duration Fund | Avoid equity volatility for near-term goals |
| Child’s education (15–20 yr horizon) | Equity Mutual Fund | Long runway maximizes compounding |
| Retirement corpus (25+ yr horizon) | Equity + Hybrid MF blend | Maximum long-term wealth creation |
| Senior citizen, risk-averse | Senior Citizen FD + Monthly Income Plan | Higher FD rates + peace of mind |
Explore our best mutual funds in India curated list to find funds matching your risk profile and goals.
Expert Verdict: The Final Word on FD vs Mutual Funds
After examining 25 years of data, the answer to the Mutual Funds vs FD debate is not binary — it depends on your time horizon, risk tolerance, and tax bracket. But for the majority of working Indians between ages 25–55 with a long investment horizon, the data overwhelmingly favours equity mutual funds.
- Emergency Fund (3–6 months): Keep in FD or liquid fund — never invest this in equity.
- Short-term goals (<3 years): FD, short-duration debt funds, or arbitrage funds.
- Medium-term goals (3–7 years): Hybrid mutual funds or balanced advantage funds.
- Long-term wealth building (7+ years): Equity mutual funds via SIP — the proven path to real wealth in India.
- Tax saving: ELSS over 5-year tax-saver FD every time — better returns, shorter lock-in.
The biggest financial mistake most Indians make is treating all their savings the same — stuffing everything into FDs out of fear. Diversification is not risky; over-concentration in low-return instruments is risky. Build a portfolio that serves each financial goal with the right instrument.
Begin your mutual fund journey with our beginner’s guide to investing, and explore top-rated mutual funds for every investor profile. Check AMFI’s official data at amfiindia.com for fund performance verification.
🚀 Ready to Start Your Wealth-Building Journey?
Don’t let inflation silently erode your savings in an FD. Start your SIP today — even ₹500/month, invested consistently in equity mutual funds, can become life-changing wealth in 20–25 years.
📈Frequently Asked Questions (FAQ)
Get Free Investment Insights — Right on WhatsApp!
Join thousands of smart Indian investors who receive weekly tips on mutual funds, SIPs, tax saving, and market trends — completely free, directly on WhatsApp.
🔒 Your number stays private. Unsubscribe anytime with one tap.
This article is for educational and informational purposes only. The return figures used are based on historical data and assumed CAGRs — actual returns may vary. Mutual fund investments are subject to market risks. Please read all scheme-related documents carefully before investing. This is not SEBI-registered investment advice. Consult a qualified financial advisor for personalized guidance. Past performance is not indicative of future returns. Data references: SEBI, RBI, AMFI India, Income Tax India.